Live updates
How the add-on rebuilds after every change, where errors show up, and the tools for seeing what your nodes generate.
You don't build or reload anything by hand. Every change to a node, a link, a script or a setting rebuilds the add-on, and a moment later Blender runs the new version. If the new version has a problem, the error shows on the node that caused it, and the last version that worked keeps running.
What happens on a change
- A change only marks the add-on as changed. Typing into a field doesn't rebuild on every key, and many changes at once rebuild once.
- About ten times a second, Scripting Nodes checks for changes. If there are any, it turns every node tree into Python again. Nodes store no code, so what you see in the graph is always what gets built.
- Files that changed are written to the add-on's folder. Then the add-on is disabled and enabled again, like turning it off and on in the preferences.
Undo, redo, opening a file and changing the add-on's settings rebuild too. Edits to a script (a text block or a file on disk) and to the files of assets are picked up the same way, a moment after you make them.
Because the add-on is enabled again on every rebuild, everything it registers starts fresh: panels, operators, handlers, timers. Values in properties are saved in Blender data and survive. Values in global variables are reset.
Rebuild Addon, the refresh button in the node editor's header, rebuilds and reloads right away. You rarely need it. Use it when something outside Scripting Nodes changed that it doesn't watch.
To pause the live add-on, uncheck the box in the header of the sidebar's Addon panel. It's disabled until you check it again. Exporting works either way.
Errors
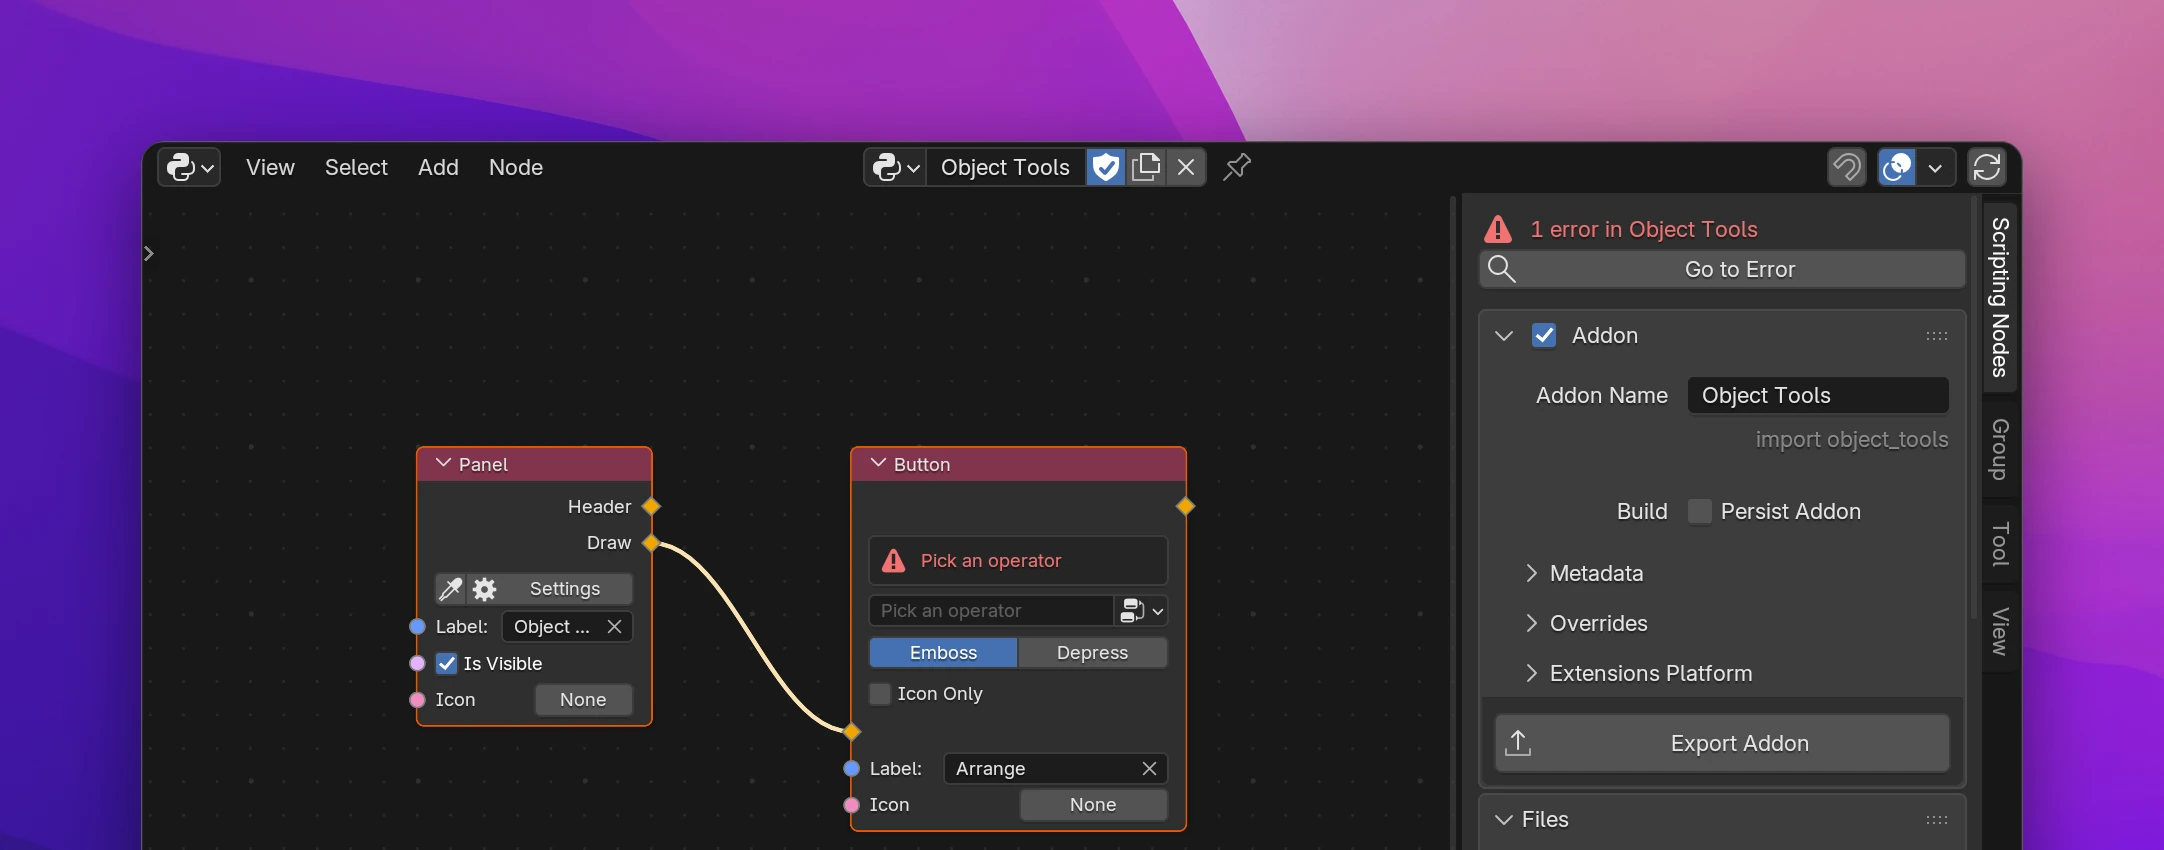
Errors show where they come from. The status line at the top of the Scripting Nodes sidebar counts the nodes with errors in all trees (1 error in Object Tools). Go to Error jumps to the next one, also in another tree.
| Error | When | Where it shows | What runs |
|---|---|---|---|
| Node error | A node can't write its code: a missing pick, types that don't convert, a value from another flow | Red box on the node, the status line | The rest of the add-on. The broken node is left out, see below |
| Syntax error | The code doesn't compile, e.g. from a Python Statement node | The addon couldn't be loaded in the sidebar, and the node that wrote the line | The previous version |
| Load error | The new version fails to import or register | The addon couldn't be loaded, and the node that wrote the failing line | The previous version, restored |
| Runtime error | Code raises an exception while the add-on runs: a button is clicked, a panel draws, a handler runs | Red box on the node that wrote the failing line, the log overlay, Blender's usual error report | Everything. Only that call failed |
A node with an error is left out of the add-on. In a flow, the nodes after it still run. A value node with an error gives None. A broken root node (an Operator, a Panel) is left out with its whole flow.
Some nodes show what they still need in a gray box (Pick an operator). A node that nothing uses isn't built, so it shows hints instead of errors until it's connected.
The addon couldn't be loaded shows the last lines of Python's error message. The copy button next to it puts the whole message on the clipboard, which helps when you ask for help.
Runtime errors stay on the node until the next rebuild clears them. If the same error comes back, it shows again the next time the code runs.
Errors in a script of the Files list show on the script, with its name and line: ZeroDivisionError: division by zero (helpers.py, line 4).
The log overlay
Print nodes and runtime errors show in the top left corner of the node editor. Each line fades out after ten seconds, at most 20 lines are shown, and a repeated message is counted ((x3)) instead of repeated. Print writes to Blender's system console too.
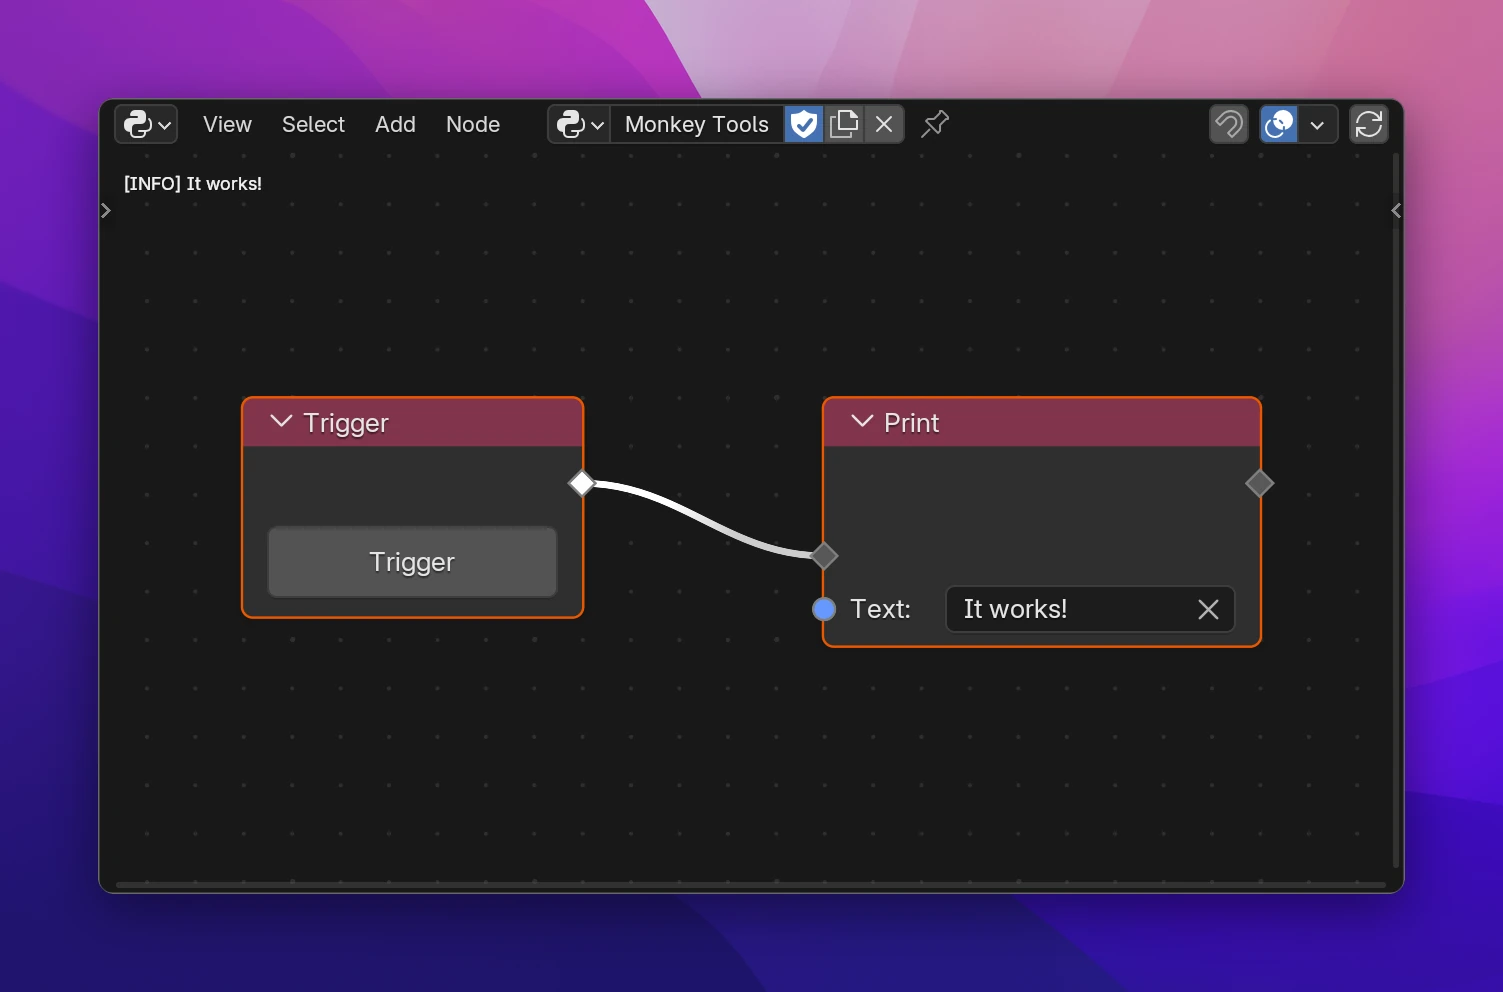
In an exported add-on, Print is Python's print(): it only writes to the console.
Seeing the code
Show Node Code (Settings › Development in the sidebar) shows the lines each node wrote, in a box on the node. It's the quickest way to see why a node doesn't do what you expected.
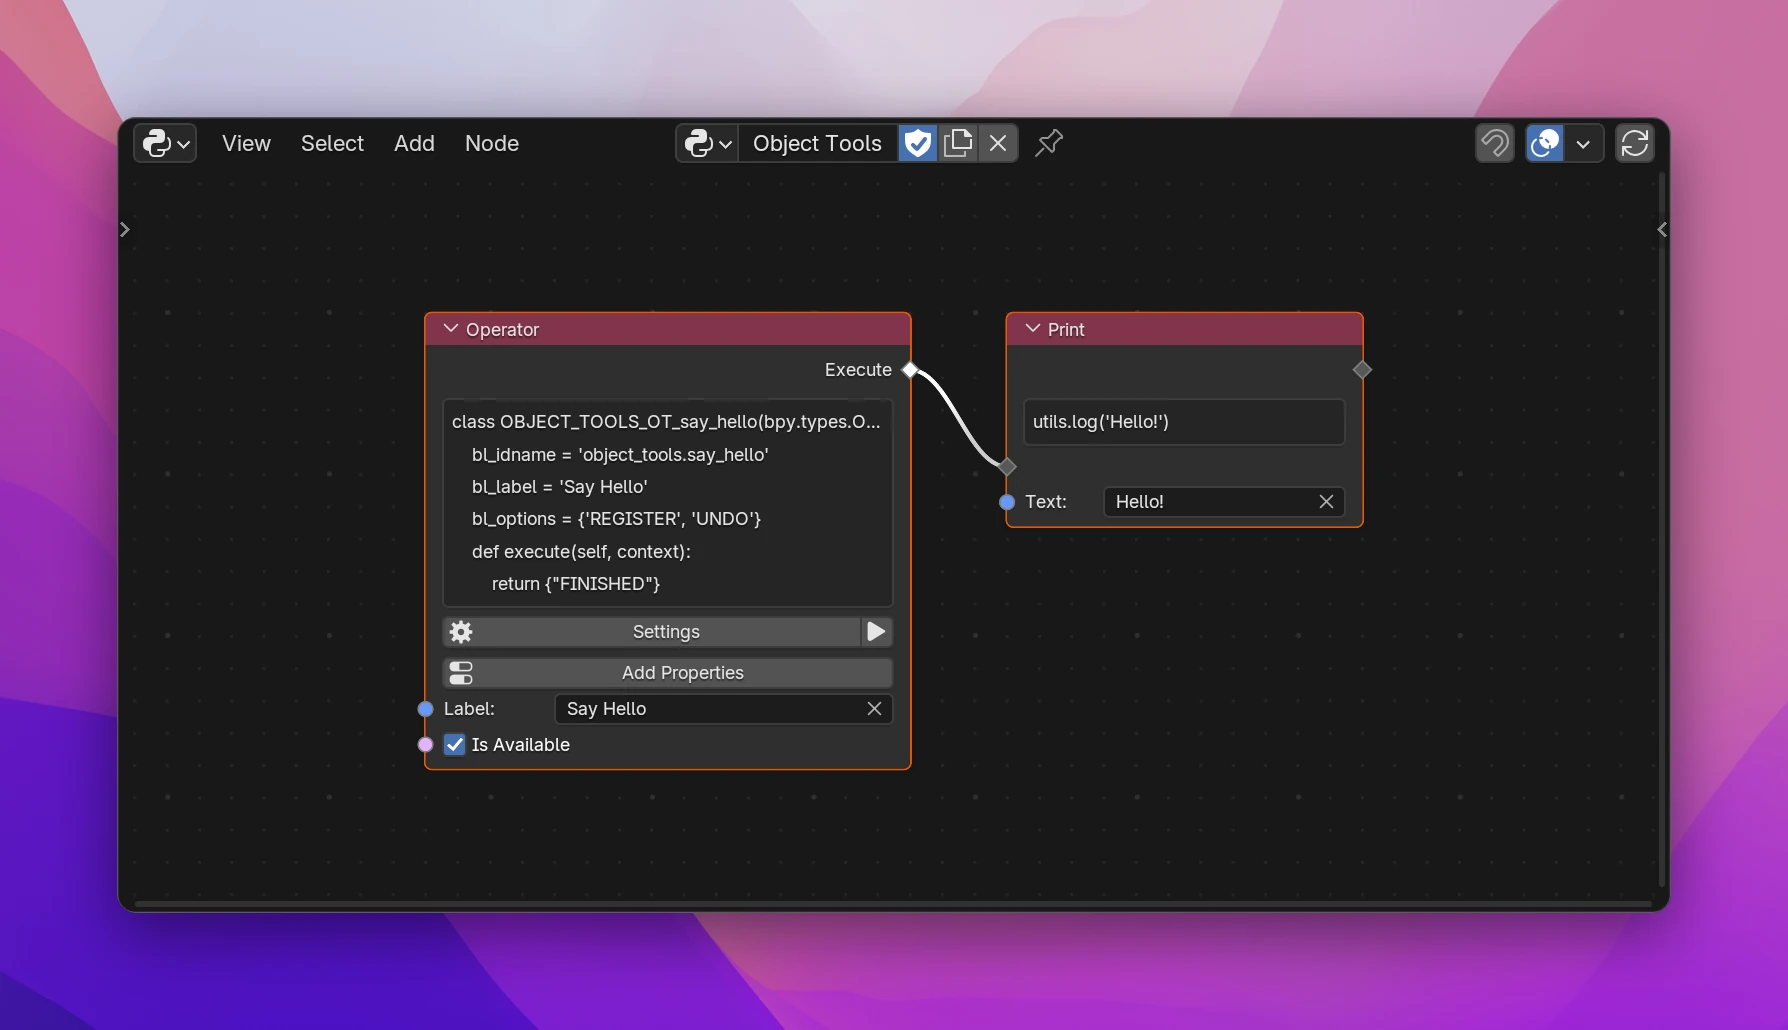
The box shows up to 40 lines, cut at the node's width. Make the node wider to read more. To read the whole add-on, export it, or open its folder in Blender's user scripts folder (scripts/addons/<module name>, see Add-on and files).
Development settings
Settings › Development in the sidebar:
| Setting | Does |
|---|---|
| Log Tree Rebuilds | Logs how long building the code took |
| Log Reload Times | Logs how long reloading the add-on took |
| Log Overlay | Shows prints and errors in the node editor. On by default |
| Overlay Font Size | Text size of the overlay |
| Show Node Code | The code box on every node |
Limitations
- Runtime errors are found by wrapping the add-on's functions and the methods Blender calls on its classes (
execute,invoke,modal,draw, ...). An error in a property's update callback, or in a function another module imported before the wrapping, shows in the console but not on a node. - Errors aren't saved in the
.blendfile and undo doesn't bring them back. They describe the current session. - The live add-on differs from the export only in small ways: Trigger nodes, Print's overlay, and the
bl_infoit's loaded with. See Export.